

Refuting “evidence” for anthropogenic global climate change
Guest post by Petter Tuvnes, MSc

When results of measurements or data are less than the uncertainty of the data, then it is not possible to draw any certain conclusions based on the data. However, this is the case of the man made climate narrative, whose supporters are quite so certain. Change of global temperature or other climate variables are so small that the changes are not statistically significant, and may thus be just natural random deviations from natural conditions (e.g. Dagsvik & Moen20231). “Evidence” that global climate change is anthropogenic can be refuted with the climate alarmists’ own reports, data, and models. Global temperature and climate change are natural phenomena where the sun, clouds and atmospheric pressure are the most important factors.
Radiation data
Climate alarmists, enriched by Artificial Intelligence (AI), suggest that the measurements and report by Feldman et al. (2015)2 are the best evidence that current climate change is anthropogenic.
The AI Grok asserts: ”Feldman et al. (2015) is likely the strongest measurement-based evidence for human governance of global climate.”
Feldman et al. measured changes in the radiation from the atmosphere to the Earth’s surface at the wavelength where CO₂ emits radiation (15 μm) during the period 2000 to 2010. From their Abstract: “The time series both show statistically significant trends of 0.2 W m−2 per decade (with respective uncertainties of ±0.06 W m−2 per decade and ±0.07 W m−2 per decade) and have seasonal ranges of 0.1–0.2 W m−2.”
The instrument they used (AERI) has an accuracy of better than 1% of the radiation from a blackbody at ambient temperature at the Earth’s surface. At 14 °C (287 K), that radiation is 384.5 W/m2, and 1% is 3.8 W/m2. The measurements by Feldman et al. over 10 years are then less than 1/10 of the accuracy of the AERI instrument. Measurements that are less than the accuracy of the measuring instrument are not reliable. However, Feldman et al. nevertheless claim that the accuracy is better with narrow wavelengths and a sufficient number of measurements. For an average value to be accurate enough for quantification, the signal is often required to be 10 or 4 times the uncertainty according to traditional Test Accuracy Ratio (TAR) depending on the desired level of confidence. The results by Feldman et al. are clearly below these limits and no “evidence” of man-made climate change.
Feldman et al. could not relate the measurements of radiation directly to the measured change in temperature because at one measuring site (Alaska) the temperature decreased during that period and increased at the other site (Oklahoma), while global temperature was almost constant (hiatus). The relationship between measured radiation and temperature must therefore be calculated indirectly based on models.
The measurements by Feldman et al. suggest that anthropogenic emissions of “greenhouse gases” have led to an increase in radiation towards the Earth of up to 3 W/m2 (0.02 W/m2 per year) since the 19th century with very little emissions in the first 100+ years. Such calculations are approximate with very large uncertainties.
The UN Climate Panel’s IPCC report AR6 WG1 asserts that the total anthropogenic impact since pre-industrial times (1750) is approximately 2.7 W/m2, where CO₂ emissions have contributed 2.0 W/m2. The measurements by Feldman et al. are of the same magnitude as the IPCC models.
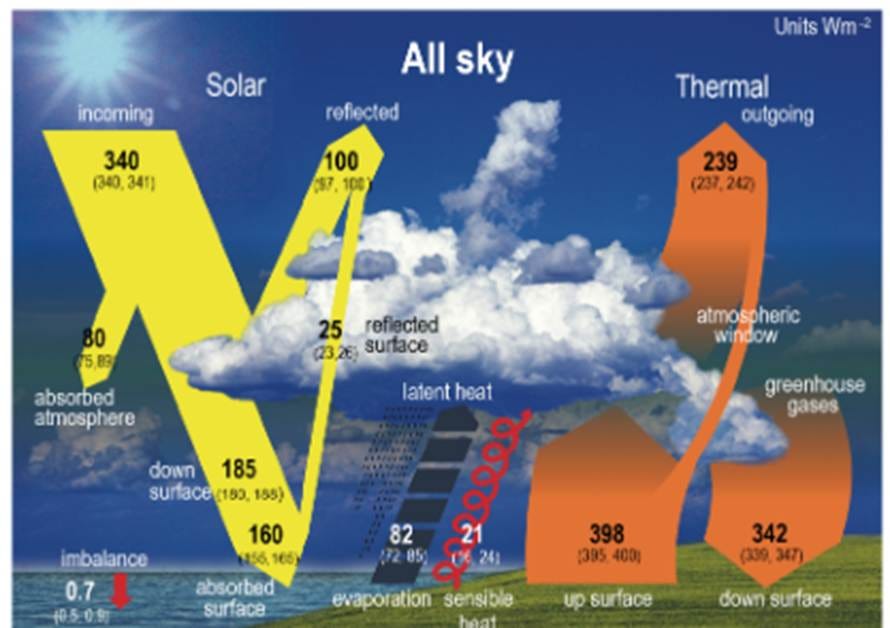
IPCC AR6 WG 1 illustrates the greenhouse effect with their explanatory figure 7.2, reproduced above. It states that the sun radiates down to the Earth with an average intensity over 24 hours of 160 W/m2 (uncertainty +6, —4), while radiation from “greenhouse gases” in the atmosphere is more than twice as strong as the sun and at 342 W/m2 (+5,—3). However, the sun is the energy source, so that the atmosphere should supply over twice as much radiant energy is nonsense. The static flat Earth energy budget of the IPCC without Earth rotation is a false model since the round Earth rotates and the atmosphere is highly dynamic.
At the top of the atmosphere (TOA) one can measure an average of over 24 hours of solar radiation hitting the Earth (340 W/m2, +1/—0) and thermal radiation emitted (239, +3/—2) and which together provide balance and relatively stable global temperature. The IPCC believes that the imbalance that causes warming is 0.7 W/m2, but this imbalance is less than the uncertainty and could therefore just as easily be 0 (zero). Not certainly measurable.
Both modeled (IPCC) and measured (Feldman et al.) “human-caused” global warming by “greenhouse gas” radiation is therefore so uncertain that it is impossible to determine with reliable accuracy if it is correct.
“Greenhouse gases” cause radiation “feedback” of 342 W/m2 down to the earth according to IPCC. Man-made contributions are max 3 W/m2 (less than the uncertainty in the estimates). This is about 1% of natural influence. It is so small that it disappears in uncertainty. Measurements that are smaller than the uncertainties are not reliable. They could just as well be zero.
Since CO₂ emissions have no certain measurable effect on global temperature, there is also no measurable effect on global climate because more than 100 other phenomena affect climate (prof. Stott, UK).
An independent climate analyst, Dr. Roy Clark3, issued comprehensive critical reviews of the invalid concepts of radiative forcings, feed backs and climate sensitivity that have been accepted by the IPCC and used in all six of the IPCC Climate Assessment Reports. Dr. Clark concludes: “A thermal engineering analysis of the interactive, time dependent surface energy transfer processes that determine the surface temperature demonstrates that it is impossible for the observed increase in atmospheric CO₂ concentration since 1800 to have caused any unequivocal change in surface temperature.”
CO₂ and temperature data
Currently there is a total of about 430 ppm (parts per million) CO₂ in the air (= 0.043%). In the textbook by Prof. John Houghton, “The Physics of Atmospheres”, 2002, it is implied that total CO₂ accounts for less than 3% of the “greenhouse effect”, while water H2O(g) accounts for about 96% (MIT article)4, verified by Prof. Koutsoyiannis.5
In a new paper, Veyres et al.6 suggest that anthropogenic CO₂ emissions are only 5.5% of total CO₂ i.e. only 24 out of 430 ppm. This is only 5.5% of 3% of the total greenhouse effect including water (H2O), i.e. less than 0.2% of the total “greenhouse” effect. Again we see that the change in CO₂ emissions is so small that it has no measurable effect on the total theoretical “greenhouse effect”, as CO₂ emissions disappear in the uncertainty and variations of measurements. CO₂ is quickly absorbed in cold water and the residence time of CO₂ in the air is on average only 5 years and not 1000+ years as IPCC claims.
Covid-19 led to reduced CO₂ emissions due to reduced industrial activity and consumption of fossil energy, but it was not measurable for total CO₂ in the air. The same took place in the 1970-ies during the oil crisis without reduction in CO₂ trend. The other “greenhouse gases” such as methane and others are even less important because there is so little of them in the atmosphere. Besides, methane decomposes quickly in the atmosphere.
CO₂ has increased a lot, from under 300 to over 400 ppm since “pre-industrial times” (1750), but only 23 ppm in the air is from human-made emissions according to Veyres et al (2025) who have reviewed recent years of research on this. Most of the increase comes from outgassing from the ocean and land with increased biological activity.
Another paper that verifies the small human influence is that by Davies.7 This states that the maximum contribution of human-sourced CO₂ to contemporary global warming is estimated quantitatively from empirical data as only “1.57% of total temperature forcing”. “The remaining 98.43% of climate forcing arises from sources other than anthropogenic CO₂”. However, the report is nevertheless very alarming, and warns of possible human extinction “by 2100 unless net human-induced CO₂ emissions into the atmosphere are ended urgently”. The alarming part of the report is not very convincing considering the resilience of the Earth for billions of years through “snowball” Earth to ice-free Earth.
There are many factors that contribute to a resilient Earth and give a relatively stable global temperature of about 14 – 15 °C, in accordance with Le Chateliers principle. The Stefan-Boltzmann equation is the strongest: a small change of global temperature T causes a strong change of radiation Φ from the Earth and into the Universe since (Φ ~ T4).
If we study the development of temperature and CO₂ over time (time series), it turns out that it is mainly temperature that changes first and then CO₂, documented by, among others, Veyres (footnote 6), Humlum et al.8 and Koutsoyiannis et al.9 . Then it cannot be CO₂ that is the cause of temperature change. It must be something else.
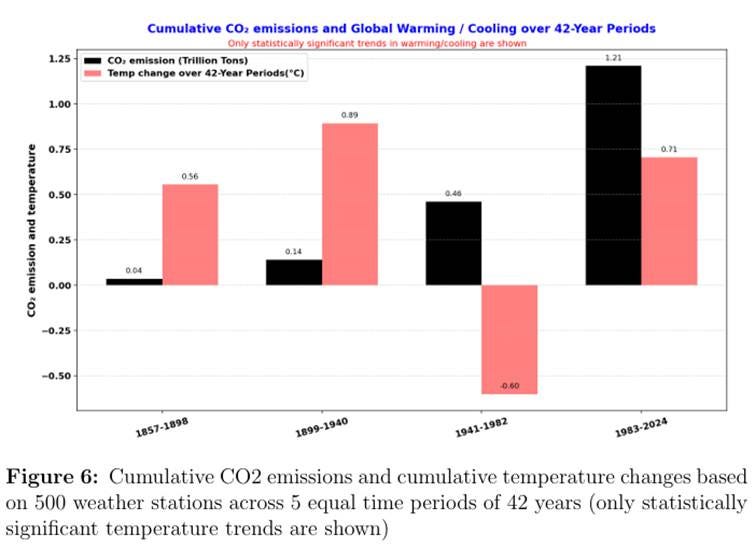
Bhatta conducted a study10 of over 60 million daily temperature observations from over 1600 global weather stations, with continuous records spanning from the pre-1900 era to 2024. Bhatta showed that temperature rose more before 1940 when CO₂ emission was relatively low compared to present when CO₂ emission is relatively high, as seen in the figure below. There is no indication that rises in CO₂ causes rise in T.
IPCC claims that CO₂ has been stable below 300 ppm in the Holocene (last 12 000 years) before pre-industrial time (1750), i.e. very low (slow) frequency of change. Temperature, nevertheless, has a high yearly frequency of change within a few °C emphasizing natural influences that still prevail. Essel et al.11 conclude: “We maintain, however, that the full range of naturally forced high- to low-frequency variability should be presented in temperature reconstructions used to contextualise recent, and in turn future, climate changes.” This is a clear critique of current IPCC negligence. Slow change of CO₂ and fast change of T do not correlate very well.
Sun, clouds and temperature
Satellite measurements of incoming shortwave solar radiation and both shortwave reflection and longwave thermal radiation out from the Earth show that since 1980, cloud cover on Earth has decreased by 2-3%, which has resulted in more sunlight and warming at the Earth’s surface (Nikolov & Zeller12). The observed reduction in solar radiation reflection (albedo), mainly from reduced cloud cover, together with reported variations in total solar irradiance (TSI), explains 100% of the global warming trend and 83% of the annual variation in global surface temperature (GSAT), documented by six satellite and ground-based monitoring systems over the past 24 years.
It has been suggested that aerosols from industry or volcanoes are reducing the importance of clouds, but this is refuted in the recent paper by Park & Soden.13
The atmosphere clearly has a warming effect on the Earth’s surface temperature. Compared to the Moon, without an atmosphere, the warming effect must be 90 degrees Kelvin (K ~ °C) (Nikolov & Zeller14). The mechanism of warming is described by Nikolov & Zeller15 as an effect of total solar irradiance at the top of the atmosphere (TSI at TOA) and atmospheric pressure at the surface (Ps). Greenhouse gases do not seem to have any measurable effect on this 90 K warming. The effect of TSI and Ps is also consistent with what other researchers have found (Wilde & Mulholland16 and Prof. Holmes’s17 analysis of the Ideal Gas Law (IGL) calculated for all planets with atmospheres).
Prof. Holmes also concludes that there can be no 33 K temperature increase due to greenhouse gases. IGL is universal and is used in aviation and space science. It assigns 90 K warming to the atmosphere. The greenhouse theory’s 33 K is speculative and based on erroneous models (static flat earth etc.). Both theories cannot be correct at the same time (90K + 33K). Since the IGL complies with empirical data (measurements), the greenhouse theory’s 33 K must be wrong. It is a hoax, verified in the book “Hoax!” by physicist Darwin Throne18.
The IPCC greenhouse theory states that most of the heat from the Earth’s surface causes cooling in the form of radiation, but also heating from the atmosphere in the form of a kind of recyclable radiation marked “greenhouse gases downward radiation” of 342 W/m2 in the IPCC energy budget figure. The 342 W/m2 is actually radiation from the lower troposphere due to atmospheric pressure, and not due to CO₂ re-radiation of absorbed solar energy. The atmospheric pressure heats the lower troposphere as the Ideal Gas Law predicts. The warmer air radiates infrared energy (heat) and that accounts for the measured downward radiation of 342 W/m2. The Nikolov & Zeller (N&Z) model labels that as the Relative Atmospheric Enhancement (RATE) which accounts for the increase in planetary temperature over what it would be with no atmosphere. The IPCC claims that the warming due to the GHE is 33 K, but as N&Z has proven it is actually 90 K because the warming of the planet due to solar radiation is only 198 K. The mistake is because the IPCC calculates the solar warming for a flat disk not a sphere.
Researchers Shula & Ott19 show that radiation from the surface is quickly converted to heat in the air (thermalization), and that convection is the main way heat is transported from the Earth in the lower part of the atmosphere. In the higher part with thin air, long-wave electromagnetic heat radiation takes over and goes out into space.
Artificial intelligence (AI) has shown the ability to follow demonstrable empirical arguments when it comes to climate science. Grok 3 beta et al20 in their summary state: “We conclude that the anthropogenic CO₂-global warming hypothesis lacks empirical support, overshadowed by natural drivers such as temperature feedbacks and solar variability, necessitating a fundamental reassessment of current climate paradigms.”
Conclusion
Empiricism (measurements and observations) trump more or less unreliable models from the IPCC. The greenhouse theory has been exposed as incorrect. An increase in plant CO₂ that we have had for the last 100+ years has had positive effects on life on earth and food production (UN FAO statistics). No negative effects have been proven. We can end all “climate measures” against “greenhouse gases” and instead concentrate on preparing for natural random climate change by improving infrastructure, something also scientific advisor to pres. Obama, prof. Steven Koonin, recommends in his book “Unsettled”21.
Guest posts express the views of their authors.
J.K. Dagsvik & S.H. Moen, 2023. To what extent are temperature levels changing due to greenhouse gas emissions? Statistisk sentralbyrå/ Statistics Norway.
D. R. Feldman et al., 2015. Observational determination of surface radiative forcing by CO₂ from 2000 to 2010.
R. Clark, 2024. A Nobel Prize for Climate Model Errors, Science of Climate Change.
D. Kuipers, 2011. Greenhouse gases, water vapor and you LA Times/MIT Center for Sustainability Science and Strategy.
D. Koutsoyiannis, 2024. Relative importance of carbon dioxide and water in the greenhouse effect: Does the tail wag the dog?, Science of Climate Change.
C. Veyres et al. 2025. Revisiting the Carbon Cycle, Science of Climate Change.
O. Humlum et al., 2013. The phase relation between atmospheric carbon dioxide and global temperature, Global and Planetary Change.
D. Koutsoyiannis, et al., 2013. On hens, eggs, temperatures and CO₂: Causal links in Earth’s atmosphere, Sci.
Bhatta, B., 2025. Revisiting CO₂ emissions and global warming: Implications for society.
Essell et al., 2023. A frequency-optimised temperature record for the Holocene, Environ. Res. Lett.
N. Nikolov & K. Zeller, 2024. Roles of Earth’s Albedo Variations and Top-of-the-Atmosphere Energy Imbalance in Recent Warming: New Insights from Satellite and Surface Observations, Geomatics.
C. Park & B. Soden, 2025. Negligible contribution from aerosols to recent trends in Earth’s energy imbalance, Science Advances.
N. Nikolov & K. Zeller, 2014. On the average temperature of airless spherical bodies and the magnitude of Earth’s atmospheric thermal effect, SpringerPlus.
N. Nikolov & K. Zeller, 2017. New Insights on the Physical Nature of the Atmospheric Greenhouse Effect Deduced from an Empirical Planetary Temperature Model, Environment Pollution and Climate Change.
S.P.R. Wilde & P. Mulholland, 2020. Return to Earth: A New Mathematical Model of the Earth's Climate, International Journal of Atmospheric and Oceanic Sciences.
R.I. Holmes, 2017. Molar Mass Version of the Ideal Gas Law Points to a Very Low Climate Sensitivity, Earth Sciences.
D. Throne, 2025, HOAX!: Why burning fossil fuels doesn’t cause climate change.
T. Shula & M. Ott, undated. The “Missing Link” in the Greenhouse Effect.
Grok 3 beta et al., 2025. A Critical Reassessment of the Anthropogenic CO₂-Global Warming Hypothesis, Science of Climate Change.
 | A guest post by
|
Merci pour cette compilation très éclairante.
J'ai survolé Davis 2025 qui arrive aux mêmes conclusions comme tant d'autres.
Mais je ne comprends pas son avertissement catastrophe concernant l'acidification des océans par CO2 anthropique .Faut-il en tout cas diaboliser le CO2 pour pouvoir publier ?
Point de vues plus subtil: Wei et al., 2021, Wei et al., 2015, North et al., 2014, Kelley, 2017, Helo et al., 2011, Cardenas et al., 2020, Terlouw et al., 2019, McElhany (2017) ),Caldeira et Wickett,2005:"En réalité, le pH des océans ne devrait jamais descendre en dessous de 7,0 ; autrement dit, les océans deviennent moins basiques, mais pas acides. Un tel phénomène ne pourrait se produire que dans l’hypothèse peu probable où les émissions de CO₂ dépasseraient 10 000 Pg C")
Je croyais que les océans dégagent du CO2 en se réchauffant. Dans ce contexte artificialiser et diminuer la couverture forestière, qui peuvent équilibrer le cycle CO2 O2, est la pire stratégie. L'exploitation minière nécessaire aux énergies "vertes", et leur besoin exponentiel d'espace le contraire du but recherché d'absorption de CO2. La capture de CO2 en le stockant absurde car empêchant la libération de O2
Thank you so much for this excellent and very clear article.
It is always important to return to the basics, in this case the calculation of uncertainties.
A friend recommended your site to me and I'm very grateful.
I'll spread the word about you.