The Nile’s gifts for understanding climate – Part 2
Bad news for forecast freaks and determinists
[There is also a Greek version of the post—Υπάρχει και ελληνική έκδοση της ανάρτησης]
Following the brief introduction (Part 1 of the series “The Nile’s gifts for understanding climate” referring to the booklet “Understanding Climate: Gifts from the Nile”), in today’s post I discuss some of the Nile data sets and the failed attempts to interpret them deterministically. I start with two of data sets presented in the graphs below.
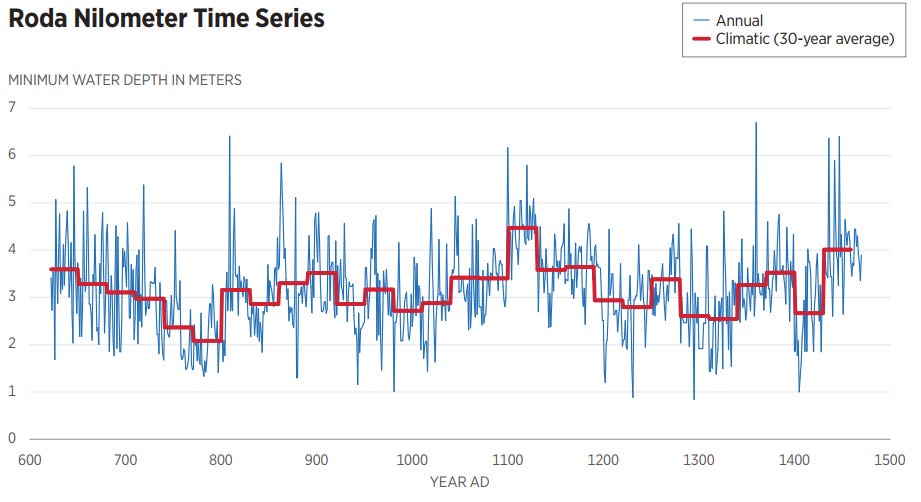
The first graph shows an almost uninterrupted time series from 622 to 1470 AD: 849 years! This instrumental record of measurements surviving to date is the longest in world history. In addition to the annual minimum river depths, the averages of consecutive 30-year periods are plotted in the chart. These are suggestive of the climate, as the most common convention for a climatic value is the time average of a 30-year period. In the 30-year period from 771 to 800, the climatic minimum depth was 2.08 meters, while from 1101 to 1130, it was 4.47 meters, more than twice as high. This huge climatic change reflects the changing conditions over vast areas in tropical and subtropical zones, as the Nile has a length of 6700 km and its basin covers more than 10% Africa.

The next graph shows the modern record of flow volumes of the Nile at Aswan for a 148-year period. Again, climatic changes are evident—especially in the drop of the flow volume at the turn from the 19th to 20th century.
Apparently, these huge climatic changes are inconvenient to climafiosi and climinions. They can hardly be attributed to emissions of humans, cows, etc. But that’s not a big problem to them as they have persuaded the climorons that those changes are not important to consider at all. Only the virtual changes predicted by their models count, as these can instill fear in the population.
But could these changes, which happened in the past, be explained, attributed to certain causes, and predicted? Certainly yes, would be the reply of most scientists, given the deterministic paradigm, on which our education is based, and the popular idea that science is virtually identical to deterministic predictability.
It is thus not a surprise that several studies have “detected” causal mechanisms of the changes. The booklet (in particular its Section 5) refers to them, some of which are funny.
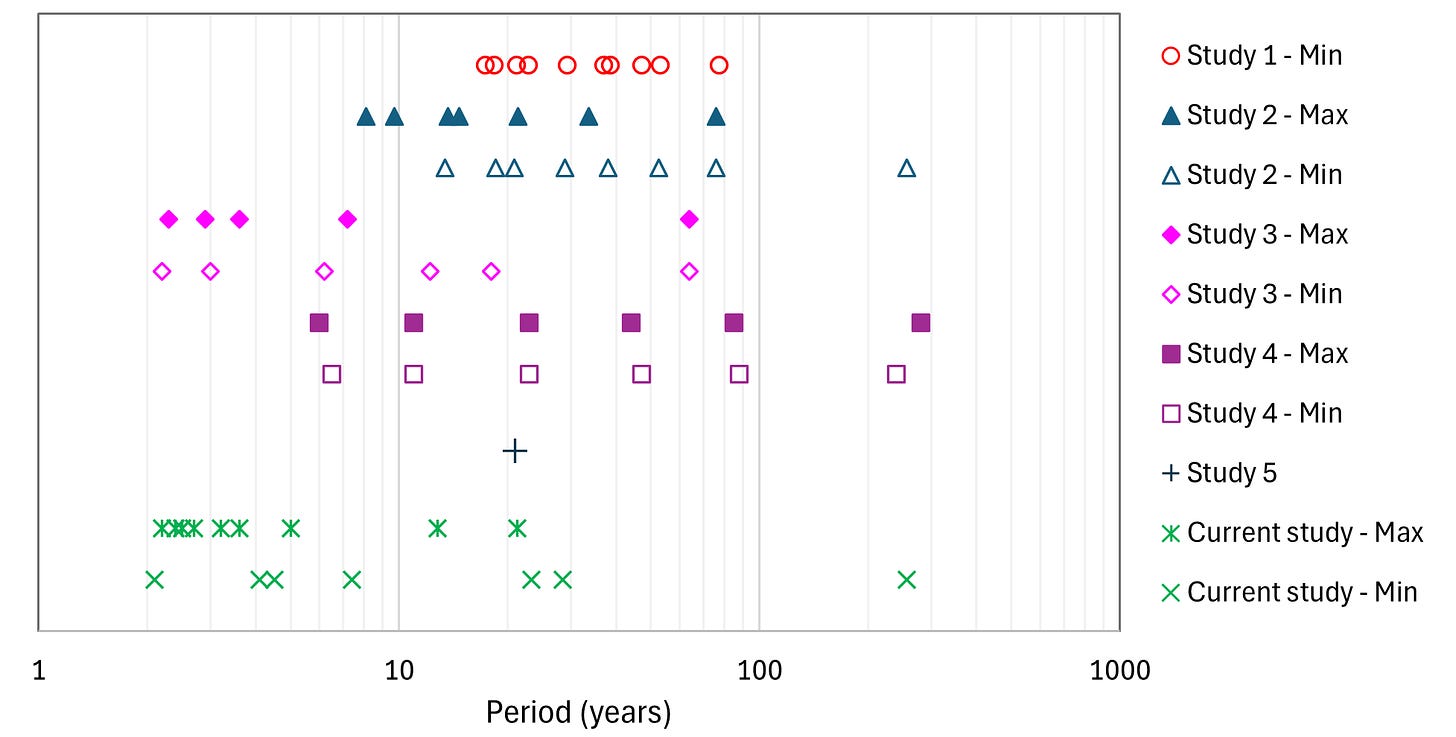
Here I only refer to one type of explanations, those which are based on periodicities “discovered” in the data and linked to causal mechanisms, mostly of astronomic type. The graph below shows a lot of periodicities “discovered” in five studies from the period 1984-2007. I avoid naming the studies here as I do not want to criticize them or their authors. I just want to refute the underlying idea that determinism should work for the climatic system, even though it works well for astronomical systems. For comparison, I have also put the values emerged in the study presented in the booklet (as explained below), which I do not call periodicities but spurious results.

Considering the studies altogether, practically any value of periodicity between 2 and 300 years can be “detected”, with uniform probability density (in logarithmic space).
Among the periodicities “detected”, the ones most highlighted in these studies lie:
in the interval that is (abusively) regarded as the range of periods of ENSO (El Niño-Southern Oscillation), usually 2 to 5 years (nb., in my view ENSO is not periodic or quasi-periodic, but antipersistent);
close to 7 years, which is thought to be linked to the biblical story of the seven fat and seven lean cows, representing, respectively, seven years of abundance and seven of drought (nb., even if the 7-year periodicity were true, it would not correspond to the biblical story, in which the period is 14 years, while the biblical numbers are of symbolic meaning, yet offering the useful information that a drought can indeed last 7 years);
close to the Moon’s nodal nutation cycle of 18.6 years;
close to 11 or 21 years, regarded to be linked to the sunspot cycles;
close to the 78 or 88 years, regarded to be linked to the Gleissberg solar cycle, or even higher, close to 260 years, again linked to solar activity.
In my view, all these “detected” periodicities are wishful thinking, reflecting confirmation bias. Most of the studies suffer from one or more of the following problems: (a) They miss the fact that the power spectrum of a time series (the periodogram—the empirical counterpart of the theoretical power spectrum) is a realization of a highly varying stochastic process, displaying many (false) peaks and thus being far different from the (usually smooth) theoretical power spectrum; (b) they usually (albeit not always) test the significance of detected periods against white noise, while, apparently, a white noise hypothesis is totally inconsistent with the Nile’s behaviour; (c) they undervalue the estimation uncertainty in stochastic processes with high autocorrelation.
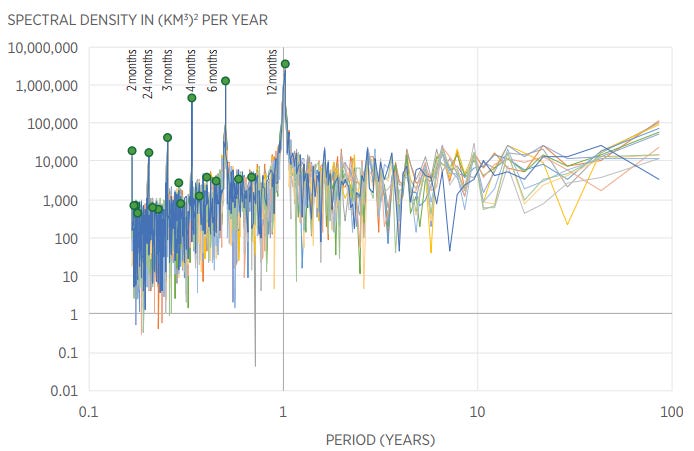
How can we use the stochastic tool of the power spectrum (and the periodogram) in a decent manner, to avoid detecting false peaks, i.e., reflections of random effects? The booklet shows two techniques, of which the first is very simple: A real peak, manifesting a deterministic oscillation, would appear at the same frequency if a part of the time series is used. Thus, by sliding the starting point by a certain number of time steps we can form different sequences with same length. Such an exercise for the modern flow record is shown in Chart 8, reproduced below. This depicts a “spaghetti graph” of 12 periodograms, each produced from a sequence of 1024 terms of the monthly times series of Aswan flows with different starting points.
Evidently, the peak that appears at the period of a = 1 year is real and corresponds to Earth’s annual orbit around the sun. All 12 components of the spaghetti graph peak at one year. Also real are the harmonics at smaller periods, that is, at periods a⁄i, with i = 1,2,3,4,5,6. For periods longer than one year, synchronization of peaks of all 12 components never appears at any period, which indicates that no real periodicity longer than a year exists. This suffices to dismiss all (but the very long) periodicities in the above bulleted list, as the periodogram of the modern flow record covers periods up to several decades.

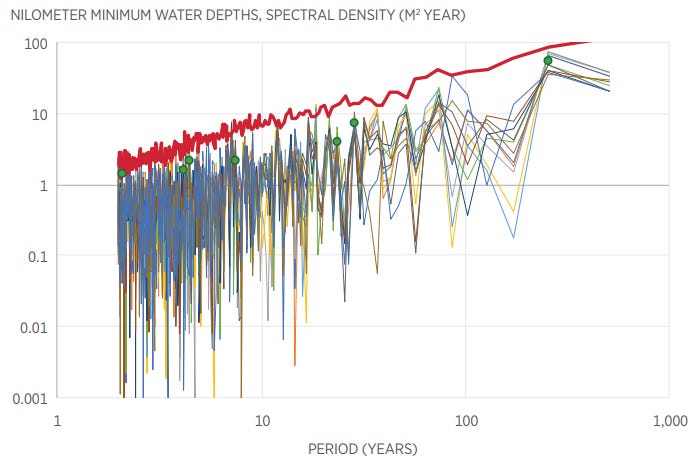
To see what happens for even longer periods we need to enroll the much longer nilometer time series. Chart 9, reproduced below, provides such information. There appears some synchronization of peaks for some periods, denoted by dots in the graph, whose magnitude is small. To quantify the statistical significance of these peaks, a Monte Carlo simulation was used. This was based on the Hurst-Kolmogorov model, fitted to the nilometer time series, which I will discuss in the next post. All dots shown in the graph are below the 99 percent prediction limit, indicating that the corresponding peaks are not statistically significant at the 1 percent level.

All in all, no deterministic controls that could enable long-term predictability can be discerned in the long Nile records.
Is this bad news or good news? In my view, it’s good news. To explain that, I am first presenting the following graph1 classifying change in four categories.
On the left we have simple systems that are predictable, without even knowing mathematics. Everybody can roughly predict the trajectory of a stone he throws. This prediction skill is not of humans only. Chimpanzees are known for their ability to throw stones, e.g. for aggression, which means that they can roughly predict the trajectories. Eagles are known to drop hard-shelled prey onto rocks to access their insides, so they are able to roughly predict trajectories.2 Considering periodic changes, everybody can roughly predict next day’s sunrise time, even without asking a chatbot. A rooster also can. Nature has been fair to its creatures, giving them the ability to predict simple systems.
The situation is different for complex systems. Knowing their detailed dynamics, or even knowing their past behaviour, can enable predictability, but only in the short term. Not in the long term. What is short term and what is long term depends on the system. For a dice, the predictability horizon is of the order of 0.1 second, while for the motion of planets it is tens of millions of years.3 For hydrometeorological prediction, the horizon is hours to days; not years, decades or centuries. Well, publications in scientific journals about the future climate at the end of the 21st century or beyond, as well as about its impacts on life, economy and everything, abound. Sometimes the horizons go beyond a century—the record prediction horizon I have seen in a published paper related to climate is one million years.
But all this has no relationship to science. It is comparable to astrology. Climate is driven by hydrometeorological processes, which do not allow long predictability horizons, and is also influenced by many other natural processes. And, by its definition, climate is a long-term property. Therefore, it is not predictable.
But why is this good news? Let us assume the contrary, that a Laplace’s demon for whom the future has no secrets is materialized, say by a sophisticated computed system using artificial intelligence—let’s call it DREAM (standing for Demon Realized Entity Artificial Machine4).
Well, DREAM is not my dream. Whose would be? Who would be the owner? Certainly not ordinary mortals (let alone chimpanzees, eagles and roosters), who would not have access to it. Access wouldn’t be fairly distributed to all. Most probably it would be owned in secrecy by a controligarch. For knowing the future enables controlling it.
The universe has taken care and therefore DREAM will remain a dream of those who know little about nature. The uncertainly, else known as entropy, rules. That’s the most important physical law (in thermodynamics it’s known as the Second Law). It is entropy that makes a die fair—try to maximize the entropy of a die and the result will be equiprobability: each outcome has probability of 1/6.5 Entropy makes life as fair as possible: even if a controligarch was able to build the DREAM machine, we may conjecture that its secret code would leak by some unpredictable action (cf. wikileaks, climategate, etc.). And it also makes life fascinating. Without the reign of entropy, i.e. uncertainty, life would be a universal boredom, and concepts such as hope, will (especially free will), freedom, expectation, optimism, etc., would hardly make sense. 6
The original graph and additional explanations can be found in my following works:
D. Koutsoyiannis, Hydrology and Change, Hydrological Sciences Journal, 58 (6), 1177–1197, doi: 10.1080/02626667.2013.804626, 2013.
D. Koutsoyiannis, Stochastics of Hydroclimatic Extremes - A Cool Look at Risk, Edition 3, ISBN: 978-618-85370-0-2, 391 pages, doi: 10.57713/kallipos-1, Kallipos Open Academic Editions, Athens, 2023.
The ancient Greek playwright Aeschylus is said to have died when an eagle dropped a tortoise on his bald head, which the eagle mistook for a rock and aimed to crack the tortoise's shell by dropping it from a height.
See my following papers:
D. Koutsoyiannis, A random walk on water, Hydrology and Earth System Sciences, 14, 585–601, doi: 10.5194/hess-14-585-2010, 2010.
P. Dimitriadis, D. Koutsoyiannis, and K. Tzouka, Predictability in dice motion: how does it differ from hydrometeorological processes?, Hydrological Sciences Journal, 61 (9), 1611–1622, doi: 10.1080/02626667.2015.1034128, 2016.
By the way the acronym DREAM was proposed, in reply to my query, by the Perplexity chatbot, which suggested the following context: “Our project, DREAM, aims to explore how Laplace's demon can be realized as an artificial machine, pushing the boundaries of predictive analytics and determinism in modern AI.”
See Digression 2.H in my book in footnote 1.
See Digression 2.I in the same book.


The Maths is way above my head. I wish I knew what a power spectrum is. The narrative parts are funny and really expose the idiocy of those who think they can make long-term predictions using computer models and deterministic ways of thinking. Thankyou, Prof Koutsoyiannis, for your work.
I am suspicious of these mathematical frequency detecting techniques (and I'm a mathematician). I feel that in many cases the best they can do is give clues for further investigation.
A case in point is "Modulation of ice ages via precession and dust-albedo feedbacks" by Ellis and Palmer (https://www.sciencedirect.com/science/article/pii/S1674987116300305), which addresses the "100,000-year problem". The "100,000-year problem" (https://en.wikipedia.org/wiki/100,000-year_problem) is that for a long time during our current ice age there was a 100,000-year glacial-interglacial cycle, and then suddenly it changed to a 40,000-year cycle, and no-one knew why. It was obviously connected with Milankovitch cycles, but why did it switch from the 100,000-year Milankovitch cycle to the 40,000-year one? Ellis and Palmer found the answer - there never was a glacial-interglacial 100,000-year cycle or 40,000-year cycle, it was a shorter cycle, but it missed beats. And the frequency-detecting maths never detected the actual frequency.
The scientific establishment has never given Ellis and Palmer the credit they deserve. Maybe it was because Ellis and Palmer negated just about everything in the establishment's climate models by showing that ultra-low atmospheric CO2 was a factor in triggering the rapid warming at the end of a glacial period.